

Non-Maturity Deposits Under Rate Stress: What to Look for in Data and Segmentation or Rethinking NMD modelling beyond averages

How can banks redesign non-maturity deposit modelling so that asset–liability management relies not on average assumptions, but on the actual structure of the customer base?
Matteo Formenti, a practitioner in behavioural modelling within bank ALM, shared an approach in which core and stable volumes are supported by a set of observable drivers: transactionality, availability of alternative products, digital behaviour, customer-level economics, and competitive pressure.
Non-maturity deposits and interest rate risk
Non-maturity deposits (NMDs) are widely used as a funding source. Their rates typically reprice with a lag relative to assets, and the persistence of balances creates a sense of stability.
But when the level and dynamics of market rates change rapidly, an uncomfortable question emerges: what portion of these balances can a bank legitimately treat as stable — and on what evidence?
The core issue is that sharp rate moves create a widening gap between what historical statistics suggest and how customers behave today. Increasingly, supervisors are concerned not only with the outcome of models, but with how credible those outcomes really are.
Two distinct roles of non-maturity deposits
In asset–liability management, non-maturity deposits serve two different purposes, and conflating them is risky.
Stable volume — the amount of funds that, with high probability, will remain with the bank and can be used as long-term funding. This is a liquidity question: what share of current account balances can safely be considered persistent.
Core volume — the portion of deposits that is unlikely to reprice even under significant changes in the interest rate environment. This is an interest rate risk question: if a liability behaves as quasi-fixed-rate and remains on the balance sheet long enough, it can fund fixed-rate assets and reduce the need for derivatives hedging.
A stable, rate-insensitive volume gives banks an economic advantage: less reliance on bond issuance for loan funding and more flexibility in asset allocation. But if the core is overestimated and rates move quickly, liquidity risk emerges alongside a potential P&L impact — assets may have been placed long and fixed, while liabilities suddenly start behaving very differently.
Why regulators are sharpening their focus on deposits
European experience has been instructive. Supervisory analyses in 2022–2023 showed that banks increased deposit rates with a lag relative to asset repricing. As a result, Supervisory Outlier Test (SOT) outcomes for EVE (economic value of equity) and NII (net interest income) shifted sharply, prompting questions about whether the SOT itself was adequately capturing risk.
Against this backdrop, the IRRBB Heatmap Implementation document was published in February 2025. It does not introduce new limits or thresholds, but sets out supervisory objectives, areas of focus, assessment tools, and reinforces proportionality (bank size, complexity, business model, and risk profile).
The heatmap highlights four areas of enhanced scrutiny:
- how banks describe NMD behaviour and embed behavioural assumptions in their models;
- what additional analyses and stress scenarios are applied on top of the standard SOT (additive analysis / stress on SOT);
- how margin effects and NII sensitivity are captured in SOT NII calculations — the commercial margin compression risk;
- how hedging strategies are designed and whether they align with the nature of the deposit base.
Why “proven” models may fail
From 2023 onwards, euro-area banks began raising rates on both NMDs and term deposits more visibly, against an already high Euribor backdrop. Yet many behavioural NMD models — including stable and core estimates — remained largely unchanged, still anchored in long historical samples.
As a result, legacy assumptions increasingly diverged from actual repricing behaviour, undermining confidence in model outputs. This creates a familiar ALM dilemma: supervisors expect reliance on history, but in periods of sharp rate moves, customer behaviour shifts faster than historical models can adapt.
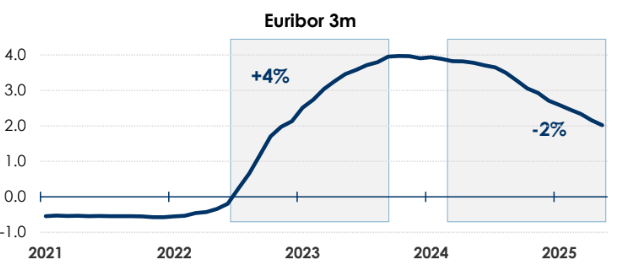
To assess whether recent years qualify as “strong rate movements”, one can simply look at Euribor 3m:
- an increase of around 4 percentage points, from −0.22% (June 2022) to +3.97% (October 2023);
- followed by a decline of roughly 2 percentage points, from 3.94% (January 2024) to about 2% (May 2025).
A tempting shortcut is to label customers whose rates did not reprice during 2022–2025 as the “most conservative core”.
The guidance, however, is explicit: this is not sufficient. The absence of repricing alone says nothing about why rates did not change — nor whether that behaviour will persist. Understanding that requires behavioural drivers and segmentation.
What to test before trusting the core number
A non-exhaustive list of factors that can materially affect stable and core estimates includes:
- customer type: transactional vs non-transactional;
- availability of alternative bank products (savings accounts, interest-bearing accounts, promotional offers, term deposits);
- internal customer characteristics (income, education, age, loyalty);
- digital engagement;
- “internal compensation” — customer-level P&L, internal FTP/TIT metrics;
- bank size and business model;
- funding strategy.
In practice, many of these are tested through segmentation: retail vs corporate, transactional vs non-transactional balances, with additional splits by currency, digital behaviour, and competitive intensity (including the impact of digital-only banks).
The key point is that the same balance can have very different economic meanings:
- transactional money for regular payments,
- a temporary parking place before investment,
- or rate-sensitive funds ready to leave when a better offer appears.
Understanding what really drives deposit behaviour
Drivers are typically grouped into two categories:
External: market rates, competitors, macro environment, alternative yields.
Internal: pricing and fees, promotions, marketing actions, product design, internal incentives.
Assessment follows two steps:
- qualitative — discussion with business units and pricing decision-makers;
- quantitative — testing which factors are actually associated with stable or core balances in the data.
If customer behaviour is primarily driven by bank actions, one modelling approach applies. If market and competitors dominate, the model must focus on explaining when and why outflows begin.
Data quality as a pillar of credibility
To forecast deposit repricing behaviour, the materials emphasise data quality and segmentation. Data quality means: long time series, sufficient granularity, sound customer clustering, product-level information, and insight into asset gathering — how customers distribute their wealth and how rate-sensitive they are.
Typical inputs include:
- total financial assets, assets under management, assets under custody, current accounts, term deposits;
- transaction counts on accounts, cards, and trading platforms;
- product type, age, location, profitability;
- segmentation rules and depth.
The objective is explainability and auditability. Where segmentation data is lacking, teams face an unattractive choice: rely on a single aggregate time series, or fill explanatory gaps with expert judgement — something supervisors increasingly view with caution.
Five principles linking models to management
The framework outlines five guiding principles for behavioural NMD models:
- models should reflect current market conditions, competition, macro factors, and plausible future paths;
- models must balance data quality against model complexity;
- stable and core volumes should be proportional to data quality and model sophistication;
- NMD WAL (weighted average life) should be proportional to data quality and complexity and aligned with the bank’s risk appetite;
- model outputs should be benchmarked against alternative models and the regulatory framework.
Confidence emerges through model competition — comparing different approaches and testing the robustness of results. This may involve multiple data treatments and segmentation schemes, from simple non-parametric methods to parametric models (for example, GBM), followed by an assessment of which outcomes are best supported by both data and business logic.
The document explicitly cautions against uncritical use of GBM (geometric Brownian motion). Importing market volatility logic into deposit modelling can be misleading. While such models may be easy to explain to management, their assumptions often do not match how customers actually hold and withdraw funds.
Accounting for customer rationality
What if customers simply move funds wherever rates are higher, regardless of segmentation?
This can be tested via opportunity cost: compare the yield of the best alternative (for example, sovereign bonds) with the rate paid on current accounts, and examine whether the spread correlates with outflows (via a simple regression). If both the spread and outflows increase together, part of the customer base is clearly reacting to alternative returns.
It is also critical to consider whether the bank offers its own alternatives (savings or term products). If not, outflow risk may be higher — and less visible in a single balance series.
Conservatism is back in fashion
Effective IRRBB management for non-maturity deposits requires using the full supervisory toolkit: customer segmentation, peer benchmarking, stress testing, expert judgement, and historical evidence.
Banks should design plausible stress scenarios grounded in behavioural assumptions and apply reverse stress testing to understand how NII and EVE respond under severe conditions.
Customer behaviour may continue to evolve. In that environment, conservatism remains prudent — even when current data appears to support more optimistic estimates.
Practical takeaways
- Treat stable and core volumes as distinct problems, and do not substitute one for the other.
- Do not attempt to “prove” core status solely by the absence of repricing — this is insufficient, even as a conservative shortcut.
- Build an evidence base around behavioural drivers: transactionality, alternative products, digital behaviour, customer economics, bank business model, funding strategy.
- Invest in data quality until segmentation becomes meaningful; otherwise, model debates degenerate into assumption debates.
- Use model competition to strengthen confidence in results.
A flawed model is not the worst outcome.
Far worse is confidence in a number that no one can actually explain.

From ESG Reporting to Capital and Liquidity: What Changes for Banks
Why ESG has moved beyond reporting and become a question of banks’ resilience: where supervisors will focus on capital, liquidity, and funding — and what this changes for treasury.

Operational Efficiency in Treasury: Liquidity Centralisation and Readiness for 24/7
Why the shift to 24/7 and instant settlement breaks not technology first, but the operating model itself: where liquidity actually sits, who has the full picture, how value dates work — and what happens if the payment rails have to be stopped.