









BI for KPI Monitoring: How to Manage Performance Every Day

Reporting tells managers what has already happened. That is not enough for day-to-day management. For some KPIs, a performance gap needs to be identified before month-end, while there is still time to change the outcome.
Freedom Bank Kazakhstan addressed this challenge by building a daily plan-versus-actual monitoring system. Natalia Melnikova, the bank’s Chief Financial Officer, has been responsible for its financial strategy and the development of the finance function since 2021. The approach positions BI as an everyday management tool, not simply another way to consolidate reports.
The Problem Is Not Excel, but Competing Versions of the Numbers
In the early stages of the bank’s analytics development, Excel remained the primary working tool. Finance and business units extracted data from operational systems and prepared their own reports.
While the business was relatively small, this approach was sufficient for day-to-day needs. As the number of customers and products grew, however, two problems became increasingly apparent.
First, frequent data extracts placed additional pressure on operational systems. Second, different departments defined customer attributes differently, worked with different data sets and applied their own calculation rules. As a result, the figures reported by the business did not always match those produced by finance.
This created additional work for managers. Before they could make a decision, they had to collect several reports, trace the source of each number and reconcile the discrepancies.
The objective was therefore not simply to produce reports faster. It was to eliminate the possibility of multiple versions of the same metric.
Build a Single Data Foundation First
To move away from fragmented calculations, the bank began developing a unified analytics environment. Its foundations included a data warehouse, standardized data marts, common calculation rules and consistent reference data for products, regions, customer attributes and other analytical dimensions.
The system evolved in stages. In 2021, Excel remained the main analytical tool. The first Power BI dashboards appeared in 2022. From 2023, analytics began operating through a data warehouse, or DWH. This separated the analytical environment from operational systems and created a single data foundation for calculations.
Power BI was not connected directly to the bank’s operational systems. Instead, it was deployed on top of the data warehouse, with analytics built from prepared data marts. According to the bank’s team, this approach helped avoid some of the integration challenges that could have arisen from connecting BI directly to multiple information systems.
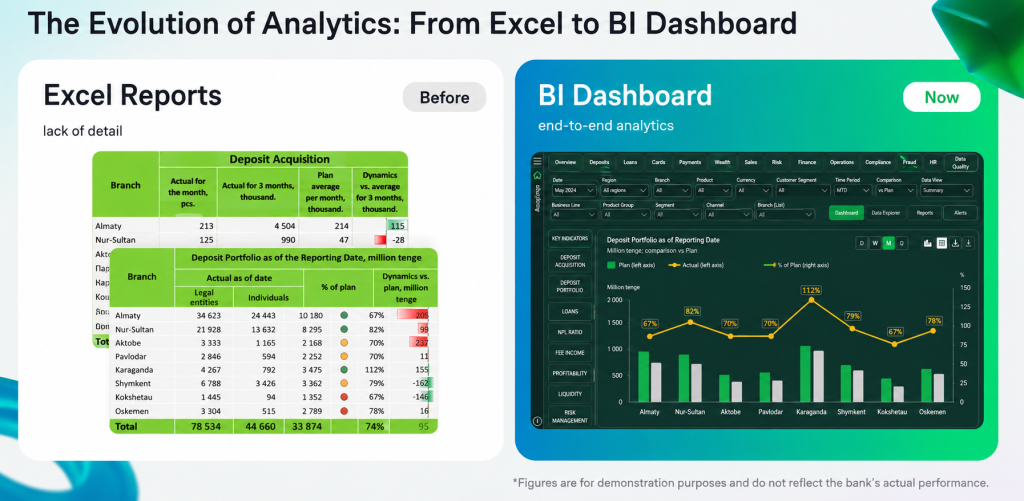
Once reference data, data marts and calculation rules had been standardized, much of the need to reconcile figures and debate whose numbers were correct disappeared. Management attention shifted from validating the data to acting on it.
This created the foundation for daily KPI management.
BI Brought Plan-versus-Actual Analysis into the Working Day
Once the common data foundation was in place, the bank could address its original objective: enabling the business to monitor performance during the reporting period, rather than waiting until it had ended.
Managers no longer need to collect reports from individual departments and reconcile the figures themselves. Dashboards show the performance of their areas across regions and products. The system is used at different levels of the organization, from senior executives to business-line and branch directors.
The management cycle focuses on the indicators that can still be influenced before the reporting period closes. A manager sees current performance against plan, identifies a gap, examines its causes and adjusts the team’s actions where necessary.
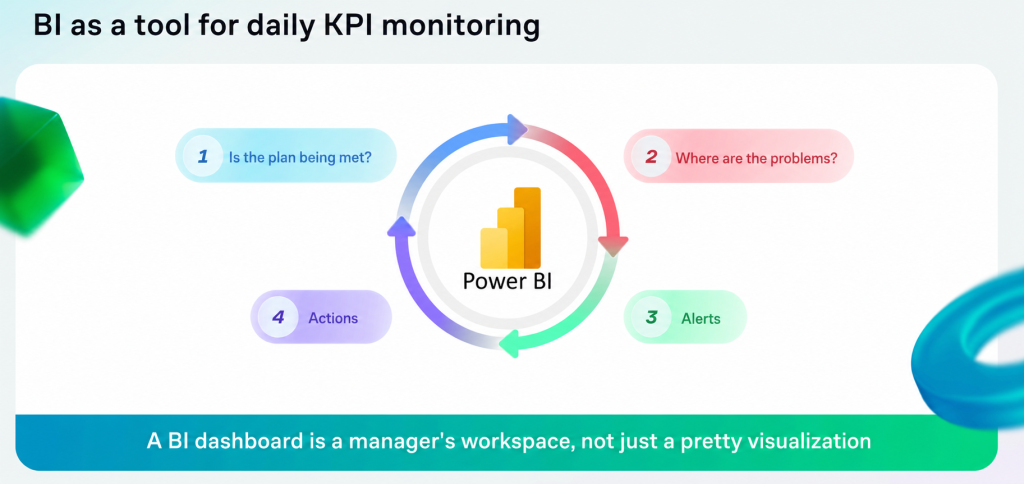
Not every KPI needs to be monitored daily. Some indicators only become meaningful over a longer period. The purpose of BI is therefore not to track as many metrics as possible at all times. It is to provide timely information on the indicators the business can actively manage.
This is where BI for KPI monitoring delivers practical value. If a performance gap becomes visible before month-end, managers still have an opportunity to respond.
Transparency Reached the Individual Employee
The next effect was behavioral. Before operational analytics became available, an employee might know how many customers they had served or how many applications they had processed. What they could not always see was how they were performing against their KPI or where their current pace of work would leave them at the end of the period.
Once performance data became available during the reporting period, employees could see the connection between their daily work and the final target. The bank observed that greater transparency strengthened accountability among employees and local managers. They could track performance trends, understand their workload and see how their results would appear to senior management.
The link between KPIs and incentives also matters. The bank uses defined performance thresholds that determine bonus levels. Access to current results helps employees understand both the final objective and how close they are to achieving it.
Who Owns the Data, and Who Owns the KPIs?
Moving to a unified system required clear accountability across the process.
During the initial stage, the specialists responsible for building data marts, structuring data and developing metrics with the business sat within the finance function. The team worked at the intersection of analytics and IT. Its members needed to understand both the business meaning of each metric and how the underlying data were structured across the bank’s systems.
Once the core architecture was in place, the team moved to a specialist department responsible for areas including data storage, regulatory reporting and IT systems. That department now maintains the analytics environment. Finance and the business units do not intervene in the technical processes used to clean and prepare the data.
The finance function retained a different responsibility: ownership of the KPI management process.
Financial indicators for business units are generated automatically within the system. For management KPI scorecards that also include non-financial indicators, the finance department participates in their design, alignment, consolidation and ongoing monitoring. The scorecards also pass through finance before they are submitted for management approval.
The model therefore separates two distinct responsibilities. The technical team ensures that the data are prepared correctly, while the finance function governs the performance management framework.
Technology Also Requires New Ways of Working
Even when the data and reporting infrastructure are in place, a new system does not automatically become part of everyday management. Moving away from Excel required employee training and changes to established working habits. Different users were comfortable with different tools, so the transition had to be managed gradually.
A sustainable BI environment also depends on a strong data culture. Employees need transparent metrics, consistent calculation rules, access to analytics and a clear understanding of how to use the information in their work.
If employees do not trust the data, or continue to maintain their own versions of key indicators, the value of a unified system quickly erodes.
BI implementation should therefore be considered complete not when the dashboards go live, but when managers and employees routinely use the same data to make decisions.
The Next Step: Personalized Analytics
The next stage of development is intended to bring analytics closer to the individual employee and customer.
The first area is personalized manager dashboards. Because business KPIs are set individually, each manager is expected to have a single workspace showing their own indicators alongside data on the customers they manage.
The second is the use of artificial intelligence in customer analytics. At present, obtaining deeper insight into a customer, their behavior or account balances may require separate queries and data extracts. The team is developing a conversational interface that will allow employees to access this information more directly.
The third area is dynamic pricing. The aim is to provide managers and middle-management teams with data that will help them make faster decisions about customer terms based on loyalty and profitability.
These initiatives represent the next stage in the system’s development. They will deliver value only if the foundations are already in place: consistent data, agreed metrics and clear governance.
Before introducing personalized dashboards, AI-enabled tools or more advanced customer analytics, an organization should therefore assess whether its KPI management system is ready to support them.
What to Review Before Introducing Daily KPI Monitoring
The bank’s experience suggests that the starting point should not be the dashboard itself. Organizations should first address several fundamental questions.
Does every indicator have a single agreed definition?
If departments use different customer attributes, data sources and calculation rules, automation will not eliminate discrepancies. It will simply produce competing versions of the same metric more quickly.
Where is the single source of data?
At the bank, BI was not connected directly to operational systems. The analytics environment was built on top of the DWH. This allowed the bank to work with prepared data marts rather than relying on operational systems as a permanent source for analytical extracts.
Is accountability for data separated from accountability for KPIs?
The technical team is responsible for storing, preparing and cleaning the data. The finance function defines the KPI methodology, coordinates and consolidates the indicators, and monitors performance. This separation reduces the risk of KPI owners being able to alter the underlying data on which their performance is measured.
Which indicators genuinely require daily oversight?
Not every KPI needs to be monitored continuously. The operational monitoring environment should focus on indicators that the business can still influence before the reporting period ends.
Do employees understand how their work affects their KPIs?
One effect of greater transparency was that employees could see current performance trends, their own workloads and their position against plan. Without this connection, a KPI remains an end-of-period assessment rather than a guide for everyday decisions.
Is the organization prepared to abandon parallel reporting?
If departments continue maintaining their own Excel calculations after BI has been introduced, and then reconcile them with the central system, a unified analytics environment has not truly been created. Training, trust in the data and adoption of common rules are therefore just as important as the technology itself.
What Matters More Than BI
BI is only the visible layer of the system. Beneath it sit consistent data, agreed calculation rules, clear accountability and the ability to act on performance information before the reporting period closes.
The quality of the dashboard is therefore only part of the equation. What matters is what happens after a signal appears. If a manager sees a performance gap but does not investigate its causes or adjust the team’s actions, analytics remains a reporting tool, even if the information is delivered faster.
BI for KPI monitoring creates value when the data changes a decision before the month-end result can no longer be changed.

Risk Management as Part of Decision-Making
Policies, risk registers and risk committees do not necessarily mean that a company is managing risk. The system begins to add value when it helps to take better decision before a mistake becomes irreversible. This article looks at how to connect risk with business objectives, involve the risk function earlier and turn indicators into management action.

How attackers enter corporate networks through employee accounts
Why the most dangerous threat to businesses is no longer external hacking, but access gained through legitimate employee accounts. How security logic is evolving in hybrid environments, how attackers penetrate internal systems, and which signals can reveal an attack before it results in data leakage or infrastructure takeover.