

High Liquidity Is Not Always a Good Thing: How to Set the Right Targets

How can banks set liquidity targets that ensure resilience under stress without sacrificing growth or balance-sheet efficiency?
Nikolay Lambov, Treasury Management and Coordination Manager at Raiffeisen Bank International, proposes looking at liquidity through two distinct lenses: as a safety buffer and as a strategic, actively managed resource aligned with the target balance sheet.
This article explains how these two perspectives come together in a liquidity ladder with clearly defined levels — and how FTP becomes a practical tool for keeping liquidity within the desired operating range while shaping business behaviour.
Why Target Liquidity Levels Became a Strategic Question
Raiffeisen Bank International Group operates across 11 markets. Its business model is largely universal banking with a strong retail funding base, complemented by corporate liabilities. The Vienna head office functions as a standalone corporate bank funded primarily through wholesale markets.
A key management constraint is that the group consists of banks that are largely self-funded, with limited ability to transfer liquidity between entities. As a result, a single group-wide liquidity buffer is neither feasible nor sufficient — each bank must have its own clearly defined liquidity target.
At the same time, the approach must:
- comply with regulatory requirements;
- support strategic objectives such as growth and balance-sheet development;
- work across different markets and funding models.
This led to the need for target liquidity levels that deliver resilience without constraining growth. The framework rests on two complementary logics: liquidity as a risk buffer and liquidity as a managed strategic resource.
Why Historical “Optimal Levels” No Longer Work
There is a natural temptation to take recent averages, pick a comfortable number, and treat it as a benchmark. But market conditions evolve — and liquidity behaves differently across cycles.
This is not accidental:
Different business models imply different LCR “norms”
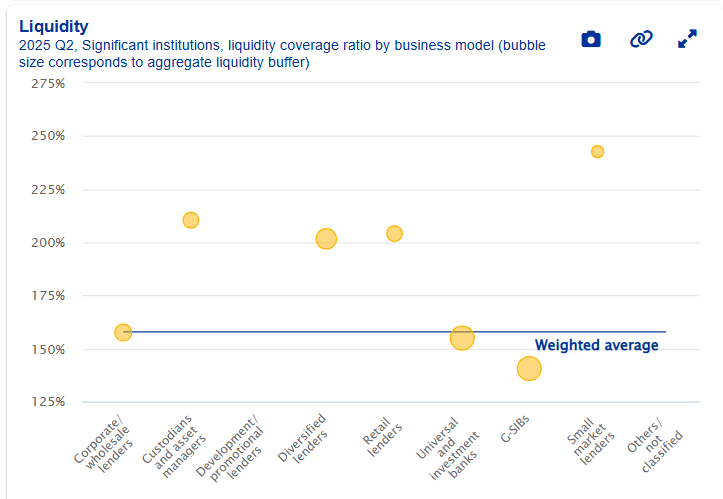
European data shows wide dispersion in LCR levels:
- wholesale-funded banks tend to sit at the lower end;
- global systemically important banks are also relatively low;
- corporate wholesale lenders often exceed 150%;
- retail-focused banks are typically above 200%;
- banks in smaller markets frequently operate above 225%.
There is no single “right” number — funding structures and risk profiles differ materially.
The interest-rate cycle affects assets and liabilities simultaneously
Rising rates tend to slow lending while increasing the attractiveness of savings products — though the dynamics differ by market. Falling rates often revive credit growth. A liquidity level calibrated in one phase of the cycle may become ineffective in another, even if regulatory ratios are met.
Liabilities can be a strategic asset
For wholesale-funded banks, the priority is stable funding of assets. In parts of Central and Eastern Europe, however, liabilities can also be a direct source of NII. Current accounts are often stable, rate-insensitive, and can effectively cost the bank zero — even when policy rates exceed 5%.
In Hungary, for example, policy rates reached 15%, while current accounts remained priced at zero. In such environments, growing deposits can become a strategic objective in its own right — directly influencing the optimal level of liquidity.
Two Liquidity Logics — and the Tension Between Them
Target liquidity levels emerge from two distinct approaches: a risk-based perspective and operational liquidity management.
Risk-based approach: liquidity as protection
The goal is to maintain sufficient liquidity to survive stress while remaining above regulatory thresholds. The logic is defensive: the bank must withstand adverse scenarios under any circumstances.
However, this alone is insufficient for running the business. A stress buffer does not guarantee that liquidity will support growth or balance-sheet plans.
Operational management: liquidity as a strategic resource
Here, liquidity is aligned with the target balance sheet and strategy — including balance-sheet size, structure, business model, and P&L objectives.
This creates an inherent tension. Excess liquidity depresses returns and distorts balance-sheet structure, while insufficient liquidity constrains growth.
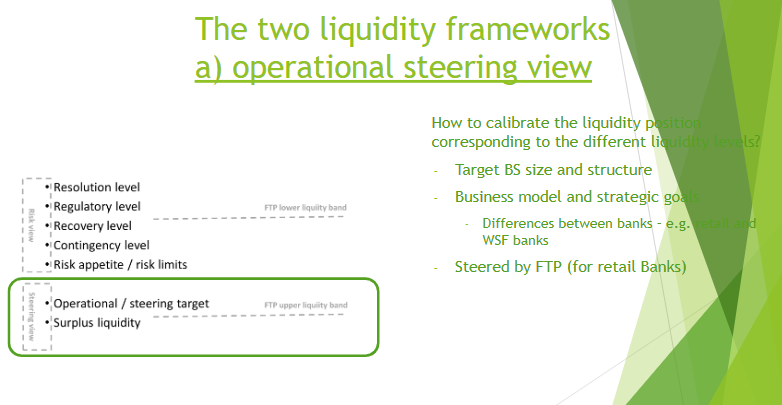
From Concept to a Manageable System: The Liquidity Ladder
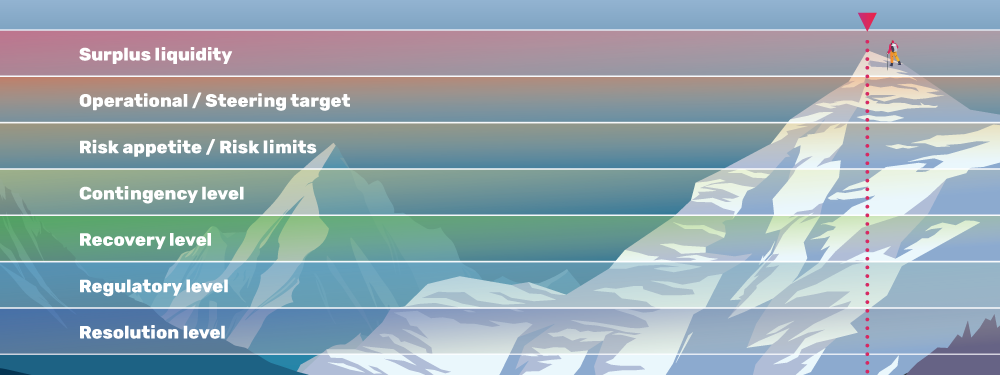
To move beyond the binary debate of “too much or too little,” liquidity can be structured into a ladder of clearly defined levels:
- Resolution level
- Regulatory minimum
- Recovery level
- Contingency level
- Risk appetite / risk limits
- Operational / steering target
- Surplus liquidity
The lower levels define safety boundaries; the upper levels define the liquidity required to run the balance sheet smoothly and execute plans without emergency actions.
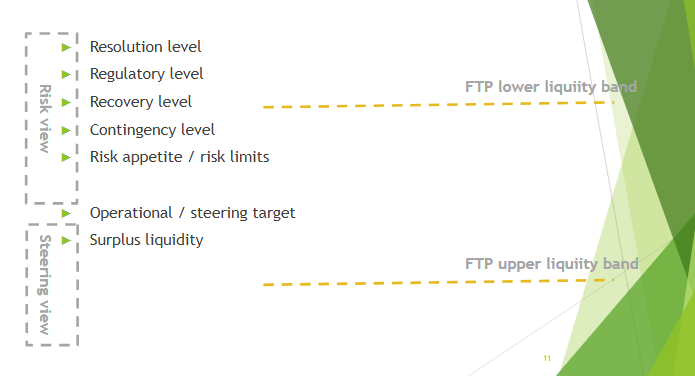
The role of FTP
Funds Transfer Pricing sits alongside this ladder as a control mechanism. A liquidity corridor is defined (FTP lower and upper liquidity bands), and FTP is used to keep liquidity within the target range by influencing business decisions.
Additional factors must also be incorporated:
- the bank’s liquidity risk tolerance;
- recovery and contingency frameworks, including actionable measures;
- the business model and resolution architecture (MPE vs. SPE);
- operational targets and steering metrics;
- profitability objectives and trade-offs in decision-making.
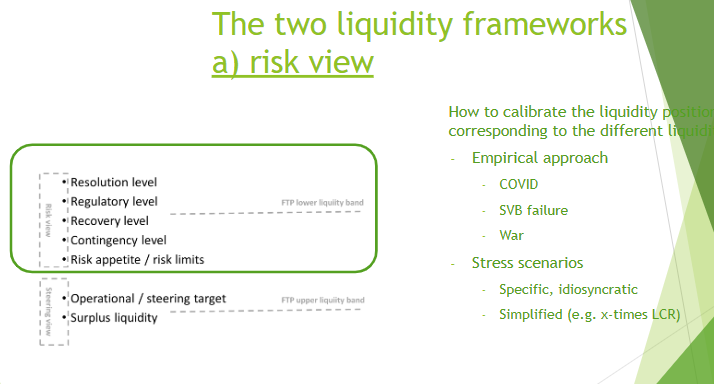
Calibrating Liquidity in the Risk Framework
Two complementary methods can be used to size the liquidity buffer.
Learning from real stress events
Recent episodes provide valuable reference points: the onset of COVID-19 (notably corporate outflows), post-SVB market stress, and the Russia–Ukraine conflict, which created multi-week liquidity shocks for certain subsidiaries.
Tracking month-to-month liquidity changes and comparing current movements to the largest historical stress deviations provides practical insight. Given strong intra-month volatility and monthly seasonality in deposits, comparing the same calendar day month-on-month (e.g. the 5th to the 5th) produces more stable signals.
Scenarios: from granular to simplified
Stress testing can range from group-specific scenarios to simplified checks such as x-times-LCR approaches, where the regulatory stress impact is multiplied by a factor. While debates over the “perfect” scenario can drag on, quick 2× or 3× checks often provide a clear sense of scale and help anchor discussions around an appropriate buffer.
Calibrating Liquidity for Operational Management
There is no universal formula for operational liquidity management, but the direction is clear: start with a target balance sheet — at least one year ahead, ideally three — and link liquidity to:
- retail and corporate growth targets;
- market-share objectives;
- P&L and NII plans;
- the underlying business model, including differences between retail-funded and wholesale-funded banks.
Here, FTP is not just about cost allocation — it is a steering tool that shapes balance-sheet outcomes. In normal conditions, FTP reflects the marginal cost of funding linked to wholesale markets. When deposits grow faster than lending, however, the relevant benchmark becomes the investment alternative for incremental liabilities.
This creates two natural constraints:
- the bank should not pay more on new deposits than it can earn by placing excess funds risk-free;
- loans must generate returns at least comparable to alternative risk-bearing investments.
The management effect is twofold: lending is encouraged when deposits exceed loan demand, while deposit pricing discipline is enforced by linking rates to the bank’s true reinvestment capacity — including placements with the central bank.
Three Situations Where Sub-Optimal Liquidity Quickly Becomes a Problem
Slovakia: loans outpaced deposits
Deposits followed expected trends, but loan demand accelerated sharply — in line with competitors. Business units responded quickly, sometimes ahead of treasury constraints, and liquidity buffers eroded. The bank had to react through the covered bond market and prepare an issuance; deposit growth alone could not have absorbed the spike.
Kosovo: loan-to-deposit ratio above 100%
A rare European situation driven by multiple factors: political gridlock limited government capital flows, while credit demand increased. The loan-to-deposit ratio exceeded 100%, compared with more typical levels around 60% in other markets.
Albania: foreign-currency inflows, local-currency demand
Economic growth attracted foreign-currency capital, while loan demand remained in local currency. Limited derivative markets in the Albanian lek prevented efficient currency transformation. As a result, deposit competition intensified, and foreign-currency inflows could not fully fund local lending. Some banks, including Raiffeisen, were unable to fully capture growth opportunities despite strong demand.
Key Takeaways
- Separate liquidity levels for survival from those for growth management. Risk buffers ensure resilience but do not replace operational steering.
- Do not anchor targets to historical averages. Changes in the rate cycle or loan-to-deposit dynamics quickly erode their relevance.
- Align liquidity targets with the business model. Retail-funded and wholesale-dependent banks operate under fundamentally different conditions.
- Use FTP as a steering mechanism. In periods of excess deposits, FTP logic naturally shifts toward investment alternatives and credit stimulation.
- Calibrate buffers using both empirical evidence and scenarios. Real events provide reality checks; scenarios add structure, while simplified tests offer speed.
Optimal liquidity is not a single number but a system of levels: lower tiers protect against stress, upper tiers support balance-sheet planning and opportunity capture. Where liquidity cannot be freely redistributed within a group, these levels must be clearly defined for each bank and actively maintained.

IFRS 9 in Practice: How Off-Market Terms Reshape Loan Valuation
How fair value, the effective interest rate (EIR), and expected credit losses (ECL) interact under IFRS 9; why off-market transactions must be unbundled into fair-value compon

From ESG Reporting to Capital and Liquidity: What Changes for Banks
Why ESG has moved beyond reporting and become a question of banks’ resilience: where supervisors will focus on capital, liquidity, and funding — and what this changes for treasury.